If you ever need assistance with plotting points on a coordinate plane you have come to the right place. We have covered the step by step process involved in marking points on a coordinate graph. Have a look at the solved examples to get grip on the topic.
Step By Step Procedure to Plot Points on a Graph
Follow the below provided steps to plot a point on a coordinate graph easily.
- At first, you need to take anyone point on the coordinate plane.
- And find the Signs of Coordinates of that point.
- Decide the point is going to which quadrant.
- Measure the value of the x coordinate on the x-axis from the origin.
- Likewise, count the y coordinate value on the y-axis from the origin.
- Draw dotted lines from those axes to get the point in the plane.
- Name the dotted lines meeting point as the given point.
Example Questions on Plotting of a Point
Example 1.
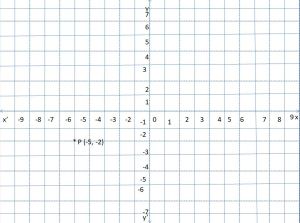
Plot the point P (-5, -2) on the graph?
Solution:
Given point is P (-5, -2)
On a graph paper draw two axes X’OX and Y’OY as x-axis, y-axis.
In point P (-5, -2) we observe that both the coordinates are negative so they will lie in the third quadrant.
Count 5 units along the x-axis to the left of the origin. Draw a line BA ┴ XOX’.
And count 2 units on the y-axis downwards. Draw a line CD ┴ YOY’.
Both these lines intersect at point P.
Example 2.
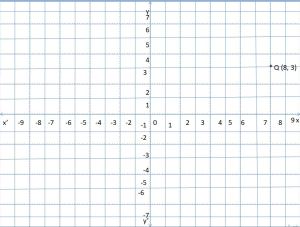
Plot the point Q (8, 3) on the graph.
Solution:
Draw two perpendicular lines X’OX and Y’OY on the graph paper.
In Q (8, 3), both coordinates are positive. So it will lie in the first quadrant.
Measure 8 units along the x-axis to the right of the origin.
Count 3 units on the y-axis to the upside of the origin.
Both lines intersect at point Q.
Example 3.
Plot the following points on a graph.
(i) A (0, 6) (ii) B (7, 3) (iii) C (5, -4) (iv) D (-2, 7)
Solution:
To plot point A (0, 6)
As the abscissa of the point is 0, the point lies on the y coordinate.
Count 6 units on the y-axis above the origin to get point A.
To plot point B (7, 3)
Draw x-axis, y-axis on a graph paper.
In B (7, 3), all coordinates are positive. So the point will fall in quadrant I.
Count 7 units along the x-axis from the origin to the right side.
Count 3 units on the y-axis to the upside of the origin.
Therefore point B (7, 3) is obtained.
To plot point C (5, -4)
Draw two perpendicular lines X’OX, Y’OY on a paper.
In point C (5, -4), the first coordinate is positive and the second coordinate is negative.
Therefore, the point lies in the fourth quadrant.
Count 5 units on the x-axis towards the right from the origin.
Count 4 units on the y-axis downwards from the origin.
Mark the point as C (5, -4)
To plot point D (-2, 7)
The x coordinate of the point is negative and the y coordinate is positive. so the point lies in the second quadrant.
In a coordinate graph having x, y axes.
Count 2 units from the left of the origin along the x-axis.
Count 7 units to the upwards of the origin along the y-axis.
Mark the point as D (-2, 7).

<!–
–>