CBSE Class 8 Maths Notes Chapter 5 Data Handling Pdf free download is part of Class 8 Maths Notes for Quick Revision. Here we have given NCERT Class 8 Maths Notes Chapter 5 Data Handling.
CBSE Class 8 Maths Notes Chapter 5 Data Handling
Data: Numerical observations collected by an observer is called data (raw data).
Frequency: The number of times an observation occurs in the given data is called the frequency of the observation.
Frequency Distribution: A way of presenting data that exhibits the values of the variable and corresponding frequencies is called a frequency distribution.
Range: The difference between the highest and the lowest values of observation is called range.
i.e., Range = Highest observation – Lowest observation
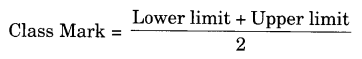
Class-mark: The mid-point of a class-interval is called class-mark.
![]()
Histogram: Grouped data can be presented using the histogram. A histogram is a type of bar diagram, where the class intervals are shown on the horizontal axis and the height of the bars show the frequency of the class interval. Also, there is no gap between the bars as there is no gap between the class intervals.
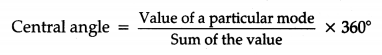
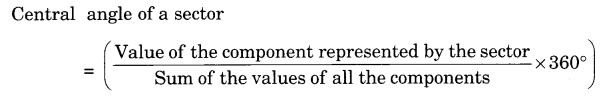
Pie-chart or Pie-diagram: A pie-chart is a pictorial representation of the numerical data by non¬intersecting adjacent sectors of the circle such that area of each sector is proportional to the magnitude of the data represented by the sector.
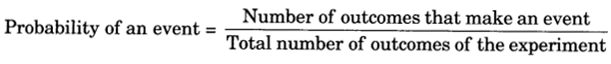
Probability: Probability is the possibility and impossibility of an event (E).
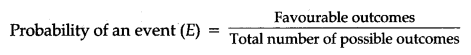
and P(E) + P (not E) = 1, i.e., 0 ≤ P (E) ≤ 1
Probability of an event can have a value from 0 to 1.
The probability to a sure event is 1.
Probability of an impossible event is 0.
If tossing a coin n times, then
Total number of outcomes = 2n [∵A coin has two faces]
e.g., A coin is tossed two times, then
Total number of outcomes = 2n = 22 = 4
i.e., S = {(HH), (HT), (TH), (TT)}
If rolling a die n-times, then
Total number of outcomes = 6n [∵ A die has six faces]
e.g., A die is throwing once, then
Total number of outcomes = 6n = 61 = 6
Random Experiment: A random experiment is one whose outcome cannot be predicted exactly in advance.
The information collected in the context of a situation under study is called data. We organize the data in a systematic manner and then interpret it. Sometimes, we represent the data graphically to get a clear idea of what it represents.
Organizing Data
The data collected originally are in general in an unorganized form. These are called raw data. We have to organize this data in a systematic manner to draw meaningful inferences.
Frequency is the number of times a particular entry occurs. To find the frequency, we use tally marks.
A table showing entries with their corresponding frequencies is called a frequency distribution table. This type of distribution is called a discrete frequency distribution.
Construction of a Discrete Frequency Distribution
Algorithm
Obtain the collected raw data.
Make a table consisting of three columns. First column is meant for the variable under consideration. Second column is meant for tally marks. Third column is meant for the total of the frequency corresponding to the variable.
Insert all the variable values in the first column in ascending order.
Pick up an observation from the raw data and mark a bar corresponding to it in the second column in front of the variable to which it is related.
Repeat this process for each observation.
Use tally marks in groups of five. To mark the fifth tally mark, cross the other four tally marks diagonally.
Count the number of tally marks against each variable and insert the total frequency of that variable in the third column against it.
A suitable title must be mentioned on the top of the table in order to indicate what the table is being prepared.
Grouping Data
For convenience, we make suitable groups of observations and find their corresponding frequencies using tally marks. Such type of data is said to be grouped and the distribution is called the grouped frequency distribution.
Each group is called a class interval or a class in brief. The smaller number is called the lower class limit and the greater number is called the upper-class limit.
The difference between the upper-class limit and lower class limit is called the width or size of the class interval.
The mid-value of a class is called the class mark.
Construction of a Grouped Frequency Distribution
Algorithm
Obtain the collected data.
Identify the maximum and the minimum value of the variate occurring in the data.
Decide how many classes will be reasonably sufficient to include all the data.
The number of classes should not be too less or too more.
Pick up an entry and draw a tally mark against the group in which it finds its place. Note that the upper limit of a class is always included in the immediately next interval.
Repeat this process for each observation.
Use tally marks in bunches of five. To mark the fifth tally mark, cross the other four tally marks diagonally.
Count the tally marks against each class. This gives the frequency of that class.
Allot a suitable title on the top of the grouped frequency distribution table indicating what it talks about.
Ensure that the sum total of all the frequencies must be equal to the total number of observations.
Bars With A Difference
We represent the groups of observations, i.e., class intervals on the horizontal axis and the frequencies of the class intervals on the vertical axis. The heights of the bars show the frequencies of the class-intervals. There is no gap between the bars as there is no gap between the class-intervals. This type of graphical representation is called a histogram.
Drawing Histogram
Algorithm
Take a graph paper and draw two perpendicular lines on it intersecting at O. One of these .must be horizontal and the other vertical.
Name the horizontal line as OX and the vertical line as OY.
Call OX as x-axis and OY as the y-axis.
Choose a suitable scale for x-axis and y-axis both. The two scales may be different.
Construct rectangles with class intervals as a base and their corresponding frequencies as the heights such that the rectangles are adjacent to each other consecutively.
Circle Graph or Pie Chart
A circle graph shows the relationship between a whole and its parts. We divide the whole circle into various sectors. The size of each sector is proportional to the information or activity it represents.
Drawing Pie Charts
The total angle at the centre of a circle is 360°. The central angles of sectors are fractions of 360°.
Chance and Probability
We face many situations where we take a chance and it does not go as per our wish. There exist many situations when the chances of a certain thing happening or not happening are not equal.
Getting a Result
A random experiment is one whose outcome cannot be predicted exactly in advance.
Equally Likely Outcomes
Outcomes of an experiment are equally likely if each has the same chance of occurring.
Linking Chances to Probability
Chances of the happening of an event lead us to find the probability of that event. Of course, we have to take into account the total number of chances related to a particular event under consideration.
Outcomes as Events
One or more outcomes of an experiment make an event.
Chance and Probability Related to Real Life
Chances and probability are related to real life. The use of probability is made in various cases in real life. For example, during elections ‘an exit poll’ is taken which gives a rough idea of the chance of winning of each candidate and predictions regarding poll are made based on it accordingly. Here, we have used a small part of the group to find the characteristics of a large group.
We hope the given CBSE Class 8 Maths Notes Chapter 5 Data Handling Pdf free download will help you. If you have any query regarding NCERT Class 8 Maths Notes Chapter 5 Data Handling, drop a comment below and we will get back to you at the earliest.
<!–
–>